
Australian property in 2026 and beyond: a guide for investors
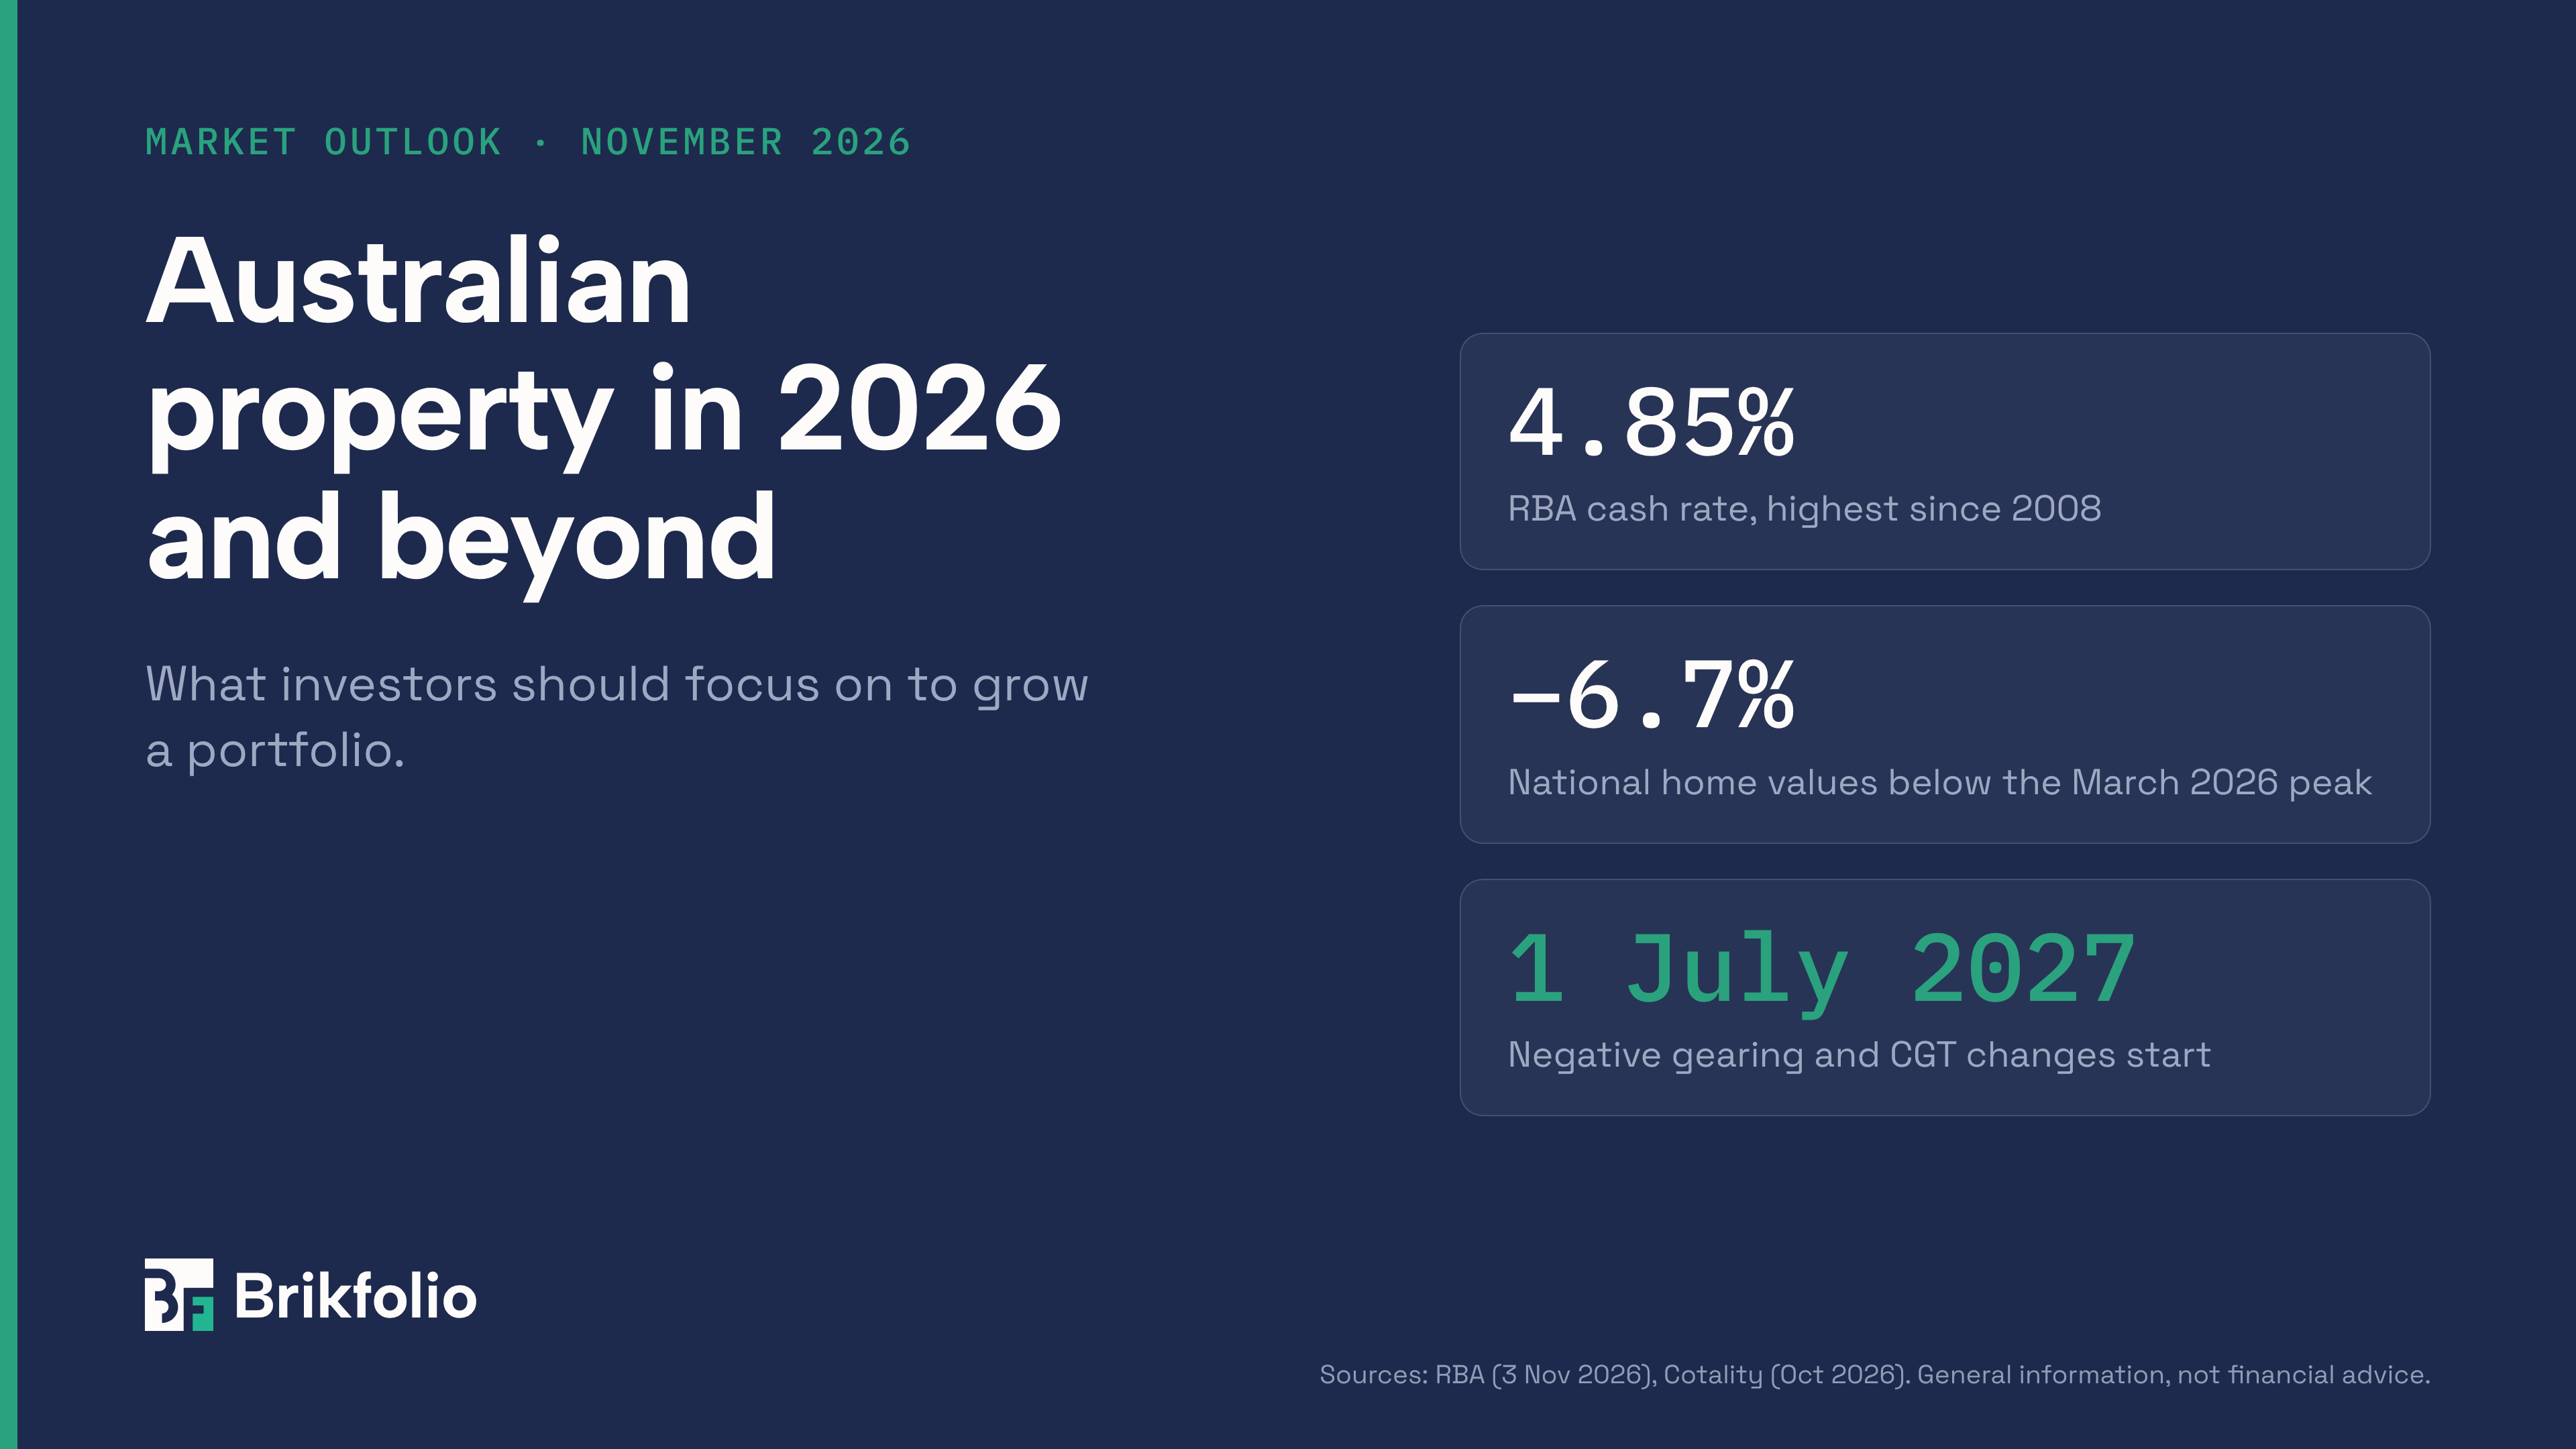
The Australian property market has turned. After a strong start to 2026, values have fallen for seven straight months. Rates are at an 18-year high. Big tax changes start on 1 July 2027. For investors, this is not a time to stop. It is a time to get sharper.
This guide covers what is happening now, what shapes 2027 and beyond, where the growth edge sits, how regional Australia fits in, and how residential compares with commercial.
Where the market stands in November 2026
National home values are 6.7% below their March 2026 peak. Cotality’s index fell 1.2% in October, the seventh monthly fall in a row. That is about $63,400 off the median dwelling. Across the combined capitals, values are down 8.1% in seven months, the fastest fall in 40 years.
The cause is clear. The Reserve Bank lifted the cash rate to 4.85% on 3 November. It was the fifth rise of 2026 and the highest level since 2008. Borrowing power has shrunk, and buyers have stepped back.
Buyers now hold more cards:
- Median time on market is 39 days, the longest since August 2020.
- Vendor discounts average 4.7%, the largest since May 2019.
- Capital city auction clearance rates sit below 50%.
- Capital city listings are at their highest for this time of year since 2019.
Rents tell a different story. Vacancy is still below 1% in Brisbane, Perth, Adelaide, Darwin and Hobart. Combined capital city gross yields are 3.77%, the highest since May 2015. Falling prices and rising rents are pushing yields up.
Three forces that shape 2027 and beyond
1. Interest rates
Rates are the biggest lever on prices right now. The RBA expects inflation to stay above 3% until late 2027. The November vote was split six to three, and the board dropped its warning about more rises. That hints the peak may be close. Market pricing does not show a cut before April 2028, though forecasters differ. Domain expects a first cut in mid-2027.
What it means: plan for rates to stay high through 2027. Treat any cut as a bonus, not a base case.
2. Tax changes from 1 July 2027
The 2026 Federal Budget changed the rules for investors. The law received royal assent on 26 June 2026.
| Change | What it means |
|---|---|
| Negative gearing | From 1 July 2027, it only applies to new builds. Established properties bought after 7:30pm AEST on 12 May 2026 can only offset losses against residential property income. |
| Capital gains tax | The 50% discount is replaced with inflation indexation and a 30% minimum tax on real gains. Only gains from 1 July 2027 are affected. |
| Existing investors | Properties held before Budget night keep negative gearing. The new CGT rules still apply to their gains after 1 July 2027. |
| New builds | Keep negative gearing and can choose either the old 50% discount or indexation. |
What it means: the after-tax case now differs between new and established stock. The same property, at the same rent, can leave two investors with very different cash flow. Get advice from your accountant before you buy.
3. Supply versus population
Australia still has more people than homes. Population grew 1.4% to 27.9 million in the year to March 2026. Net overseas migration added 292,100 people. Building has not kept up. Australia was over 124,000 homes behind the Housing Accord target by June 2026. Master Builders expects a shortfall of 204,000 homes against the 1.2 million target.
There is a twist. The December 2025 quarter added 54,000 homes, the most in one quarter since 2016. Some analysts expect that new supply to weigh on apartment prices in NSW and Victoria during 2027.
What it means: the long-run shortage supports values and rents. In the short run, watch local supply. A suburb with a wave of new apartments can lag even in a tight market.
What investors need to focus on to grow a portfolio
In a rising market, almost any purchase looks smart. In a market like this one, the basics decide who grows and who stalls. Here are seven to focus on.
- Cash flow first. With rates at 4.85%, holding costs matter more than ever. Know the after-tax cash flow of every property, not just the gross yield. A portfolio that pays its own way can ride out a long hold.
- Stress-test before you stretch. Model what another 0.25% or 0.50% rise would do to your repayments. Know how many months of buffer you hold. Lenders will test this. You should too.
- Rethink the tax maths. From 1 July 2027, new builds and established homes are taxed differently for new purchases. Run the numbers both ways for each deal. Talk to your accountant before you sign, not after.
- Buy fundamentals, not headlines. Look for low vacancy, a mix of local jobs, infrastructure spending and limited new supply. These outlast any one boom.
- Use the buyer’s market. Longer selling times and bigger vendor discounts give buyers room to negotiate. Patient investors with finance ready are in a strong spot.
- Watch your equity and lending limits. Falling values can trim usable equity. Track loan-to-value ratios on each property, so a refinance or next purchase holds no surprises.
- Spread your risk. Holding everything in one city exposes you to one cycle. Mixing states, regions or property types can smooth the ride.
The common thread is clear, current numbers. Investors who know their position can act when others freeze.
Which states have the edge for growth
The mid-sized capitals hold the edge, but none is immune right now. Domain’s forecast splits the country in two.
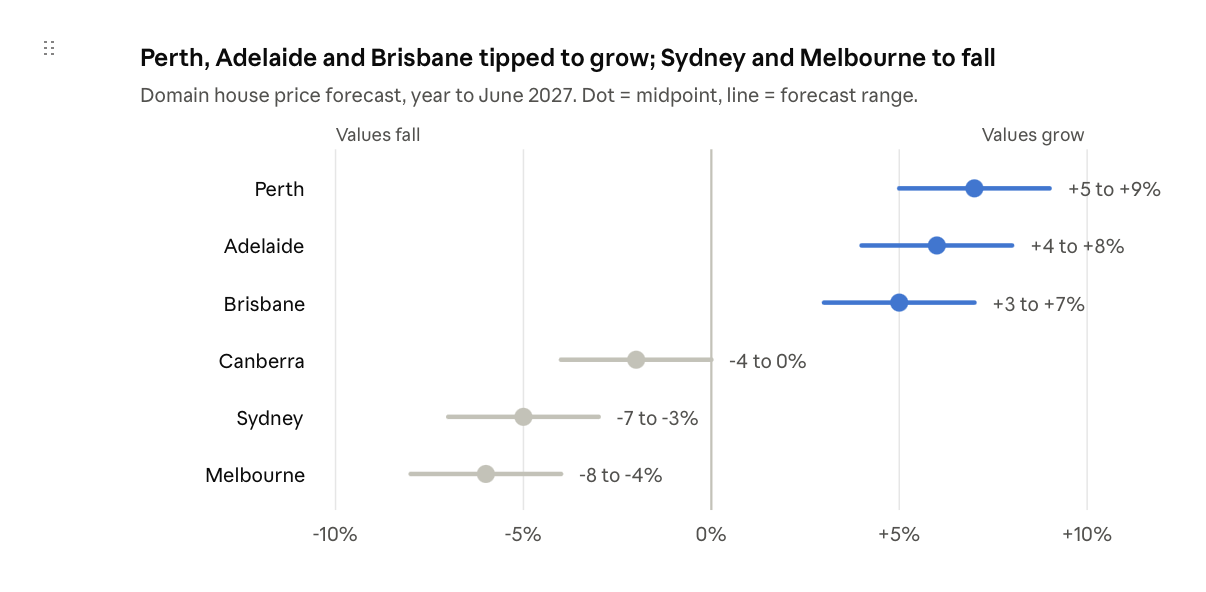
A forecast is not the full picture. Brisbane and Perth led the falls in October, down 2.0% and 1.7%. High rates are now biting everywhere. The edge below is about the next few years, not the next few months.
Western Australia. Perth houses are still up 3.9% over the year to October. Regional WA is the standout. Karratha, Busselton, Bunbury and Albany lead regional growth. Kalgoorlie-Boulder is the fastest-selling regional market, at a median of 11 days. Regional WA units return gross yields near 7.9%.
South Australia. Adelaide houses are up 3.7% over the year. Rental vacancy is among the tightest in the country. Analysts see SA, WA and Queensland as supply-constrained, which supports prices once rates ease.
Queensland. Brisbane houses are up just 0.4% over the year after a sharp October. Sales are down 29% on a year ago. Even so, Domain still tips Brisbane to grow, and the city offers the strongest commercial yields of the major capitals.
Northern Territory and Tasmania. Darwin has the highest gross rental yield of any capital, at 6.4%. Darwin units rose 13.9% over the year. Hobart houses rose 5.5%, and Hobart was one of only two capitals to rise in October. These are smaller markets. Prices can swing faster, and resale can take longer.
New South Wales and Victoria. Sydney houses fell 9.4% over the year and Melbourne 7.6%. Melbourne values are now 7.3% below five years ago. Both face a wave of new apartment supply in 2027. For long-term investors, these cities are now cheaper than they have been for years. Units are holding up better than houses, with Domain tipping falls of only 1% to 3%.
How regional Australia plays its role
Regional Australia has been the steadier half of the market in 2026. In the three months to July, regional values eased just 0.1%, while the combined capitals fell 2.5%. Over the past year, regional values have still beaten the capitals.
Three things drive this:
- Higher yields. Regional gross yields were 4.2% in May 2026, against 3.5% across the capitals. In a high-rate market, that extra income helps a property carry its own costs.
- Tight rentals. Regional vacancy sat at 1.5%, below the decade average. Regional rents have also grown faster than capital city rents.
- People are moving. The Regional Movers Index hit a record high in the March 2026 quarter. City-to-region moves outnumbered the reverse flow by 29.7%.
The standouts are mining and lifestyle hubs in WA and Queensland, plus large regional centres such as Wagga Wagga in NSW. Infrastructure such as HumeLink also adds jobs and rental demand in parts of regional NSW.
Pick the town, not the region
Regional is not one market. The regions are slowing too, and some towns carry real risk:
- One-industry towns. A mine closure or a commodity slump can hit rents and values fast.
- Investor-driven spikes. If growth comes mainly from out-of-area buyers, it can reverse. Look for strong local owner-occupier demand.
- Thin markets. Fewer sales mean longer selling times and less certain valuations.
- Lending limits. Some lenders cap loan sizes or need bigger deposits in small postcodes.
Regional property works best as part of a mix. It can add yield and balance to a portfolio built on capital city growth.
Residential versus commercial: which suits you?
Commercial property pays more income. Residential property is easier to buy, finance and re-let. Neither is better. They do different jobs in a portfolio.
| Factor | Residential | Commercial |
|---|---|---|
| Typical yield (2026) | About 3.8% gross across the capitals; 4%+ in many regions | Average cap rates: industrial 5.4%, retail 5.7%, office 6.2% |
| Lease length | Usually 6 to 12 months | Often 3 to 10 years, with set rent reviews |
| Outgoings | Owner pays rates, insurance and upkeep | Tenant often pays most outgoings |
| Vacancy risk | Low; below 1% in several capitals | Higher; national office vacancy was 16.1% in July 2026, and a gap can last months |
| Finance | Higher loan-to-value ratios, more lenders | Bigger deposits and tighter lending terms are common |
| Value driver | Land, scarcity, owner-occupier demand | Lease quality, tenant strength and yield |
| Tax from 1 July 2027 | Negative gearing limited to new builds for new purchases | Negative gearing limit does not apply; CGT changes are broader |
Where commercial stands in 2026
The commercial market is not one market. Industrial and logistics remain the strongest sector. Retail is back in favour, with higher yields than office and industrial in all five capitals analysed by realcommercial.com.au. Office is split by quality. Premium CBD vacancy fell to 10.2%, while older buildings struggle. CBRE recorded $19.0 billion of deals in the first half of 2026, up 16%.
Higher rates are a headwind. They put upward pressure on yields, which can pull valuations down. Brisbane currently offers the strongest commercial yields of the major capitals.
How to choose
- Choose residential if you want simpler finance, steady long-term growth and a deep pool of buyers and tenants.
- Choose commercial if you want higher income, longer leases and can handle bigger deposits and longer vacancies.
- Consider both once your portfolio is established. Commercial income can help balance negatively geared residential holdings, especially under the new tax rules.
Whichever way you lean, judge a commercial asset on its lease and its tenant, not just its yield.
Know your numbers with Brikfolio
Every point in this guide comes back to one thing: knowing where your portfolio stands today. Brikfolio puts it in one place.
- Portfolio dashboard and Portfolio health. See value, equity, debt, yield and where your portfolio is concentrated.
- Cash-flow analysis. Track what each property really costs to hold.
- Scenario Studio. Stress-test rate rises, see your cash runway and compare refinance options before you act.
- Loans and Valuations. Keep loan balances and property values current, so you know your usable equity.
- Tax pack. Hand your accountant clean, organised records at tax time.
- Document import. Load statements and documents instead of typing them in.
Brikfolio does not replace your accountant, broker or adviser. It gives you and them the same clear picture.
Use Brikfolio today. Sign up at www.brikfolio.com.au.
Important information
This article is general information only. It is not financial, tax or legal advice and does not consider your personal situation. Forecasts are third-party estimates and may change. Market figures are as at mid-November 2026. Speak with a licensed professional before you make investment decisions.
Sources
- Cotality: Housing downturn broadens as Brisbane and Perth lead the decline (2 Nov 2026)
- Cotality: Regional housing slowdown widens despite outperforming capitals (19 Aug 2026)
- Savings.com.au: RBA lifts cash rate to 4.85%
- Market Index: RBA hikes to 4.85%, split vote
- Budget.gov.au: Negative gearing and CGT reform factsheet
- King & Wood Mallesons: A new era of negative gearing
- Property Update: Domain FY27 forecast
- Australian Property Experts: Capital and regional market data, Oct 2026
- OpenAgent: National property market update, Oct 2026
- Canberra Times: Housing market faces 2027 price decline after supply surge
- API Magazine: Population nearing 28 million
- Australian Property Update: Three forces support the market
- MPA: Population grows to 27.9 million
- Broker News: Regional cities defy the downturn
- Broker News: Regional Movers Index record
- API Magazine: Affordable regional markets
- API Magazine: Why investors are piling into regional NSW
- Opteon: Brisbane commercial outlook 2026
- HTAG: Commercial real estate analysis, Aug–Sep 2026
- Elite Agent: Commercial sales jump, rate hikes threaten recovery
- Elite Agent: Brisbane tops commercial yields
- ANZ: Commercial property update Q3 2026