
RBA cash rate 3 Nov 2026: 4.85%, the 5th rise of 2026. Rates rose again. Is your portfolio ready?
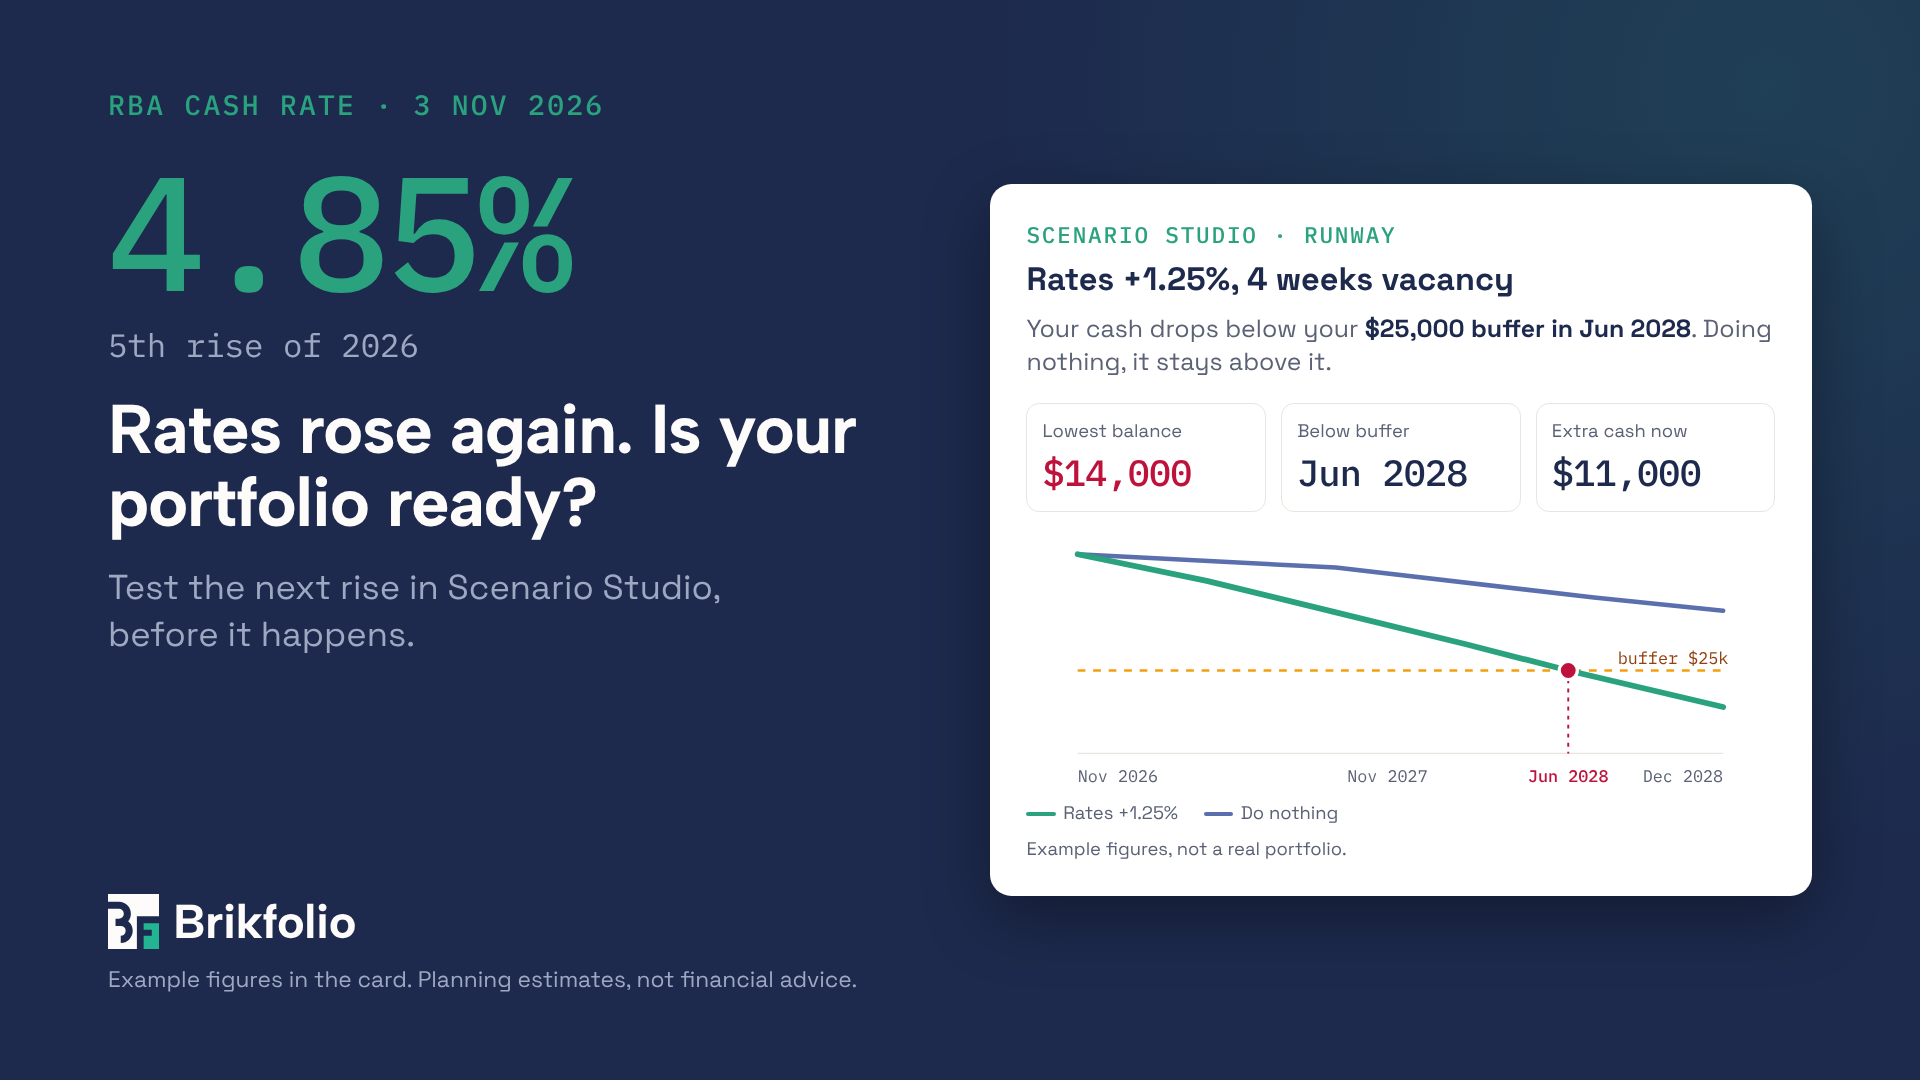
Rates are at an 18-year high. Is your portfolio ready for the next move?
On Melbourne Cup Day, the Reserve Bank lifted the cash rate by 0.25% to 4.85%. It was the fifth rise of 2026. Rates are now 1.25% higher than they were in January, and at their highest level since 2008.
The vote was split six to three. Some economists think the end is near. Others expect more. Nobody knows for sure. The next decision is due on 8 December.
For property investors, the useful question is not “will rates rise again?” It is “what happens to my portfolio if they do?” That question has a real answer. You just need the right numbers in one place.
Three questions every investor should be able to answer
- How much more rate rise can my portfolio absorb? Not just for one loan. Across every property, with rent, costs and repayments together.
- When does my cash run out? If rates rise, rent drops or a property sits empty, which month does your buffer fall below where you are comfortable?
- Is refinancing actually worth it? A lower rate looks good on paper. After fees, break costs and cashback conditions, does it still win? And when do you break even?
If you can answer all three today, you are ahead of most investors. If you can’t, you are not alone.
Why the spreadsheet stops helping
Most investors start with a spreadsheet. It works until the portfolio grows. Then the gaps show:
- The data lives everywhere. Loan statements, property manager statements, settlement papers and bank exports all sit in different places.
- It looks backwards. A spreadsheet tells you what happened last quarter. It rarely tells you what happens next year if the rate moves.
- Small errors compound. A weekly repayment entered as monthly, or rounding at every step, can throw a 10-year view out by thousands.
- Fees get forgotten. A refinance that “saves” money can cost money once break costs and fees are counted.
None of this is a skills problem. It is a tools problem.
How Brikfolio answers them
Brikfolio puts your whole property portfolio in one place, then lets you test a decision before you make it.
Get your data in. Upload a settlement statement, property manager statement, depreciation schedule or tenancy contract. Brikfolio reads it, and you review every line before it is saved.
See where you stand. Portfolio health gives you value, equity, yield, LVR, occupancy and concentration risk, with a plain-words verdict. Data health tells you exactly what is missing and links to the fix. Where a figure isn’t recorded, Brikfolio says so. It doesn’t show a confident $0.
Test the next move in Scenario Studio. Every scenario starts from “do nothing”, built from your live data. Then you change one thing at a time:
- Rate and repayment stress. Set a rate path, or switch a loan from interest-only to principal and interest. See your worst year, your break point, and the rate rise your portfolio can absorb.
- Cash runway. Add a rent cut, a vacancy or a cost rise. See your lowest balance, the first month you drop below your buffer, and the extra cash you would need now.
- Refinance comparison. Compare your current loan with a proposed one. See the net benefit after every fee, break cost and cashback, plus the break-even point.
Take it to your adviser. Save scenarios, compare two side by side, and download an evidence PDF. It lists every assumption with its source, date and confidence, so your broker or accountant can check the working.
A simple example
Example figures only. This is not a real portfolio.
Meet Sam. Sam owns two investment properties with $1.1 million of interest-only debt. If the full 1.25% of rises this year reached Sam’s loans, here is the extra interest, before tax:
| Rate change from January | Extra interest per year | Extra interest per month |
|---|---|---|
| +1.25% (this year so far) | $13,750 | about $1,146 |
| +1.50% (one more rise) | $16,500 | about $1,375 |
| +1.75% (two more rises) | $19,250 | about $1,604 |
The interest is the easy part. The harder questions are what this does to Sam’s cash buffer, and when. In Scenario Studio, Sam adds a four-week vacancy on one property and a 5% rise in costs. The runway then shows the month Sam’s cash drops below the buffer Sam set, and how much extra cash would close the gap today.
Sam then tests a refinance on the larger loan, with every fee entered. If the break-even point comes later than Sam plans to hold the loan, Sam knows it isn’t worth it. If it comes sooner, Sam has numbers to take to a broker.
Your checklist before 8 December
- Gather your latest loan statements and property manager statements.
- Note any fixed-rate loans and when they expire.
- Decide your cash buffer: the lowest balance you are comfortable holding.
- Test one more rate rise, and two. Check your worst year and break point.
- Add one bad surprise: a vacancy, a rent cut or a big repair.
- If refinancing is on your mind, compare it with every fee included.
- Book time with your broker or accountant, and bring the evidence PDF.
Brikfolio works with your experts, not instead of them
Brikfolio does the sums and shows its working. You and your advisers make the call. Every number traces back to a source, and every scenario is clearly marked as a planning estimate.
Rates may rise again in December, or they may not. Either way, you can know what it would mean for your portfolio before it happens.
Use Brikfolio today. Sign up at www.brikfolio.com.au.
Brikfolio outputs are general information and planning estimates based on the data you provide. They are not financial, tax or legal advice, a valuation, lender approval, pre-approval or a borrowing-capacity assessment. Talk to a qualified professional before making a financial decision. Example figures in this article are fictional.