
Why we built Brikfolio?
Quick question. How much equity do you have across your investment properties today?
If you had to open three banking apps, dig through your inbox and check a spreadsheet you last updated in March, you are not alone. That is exactly why we built Brikfolio.
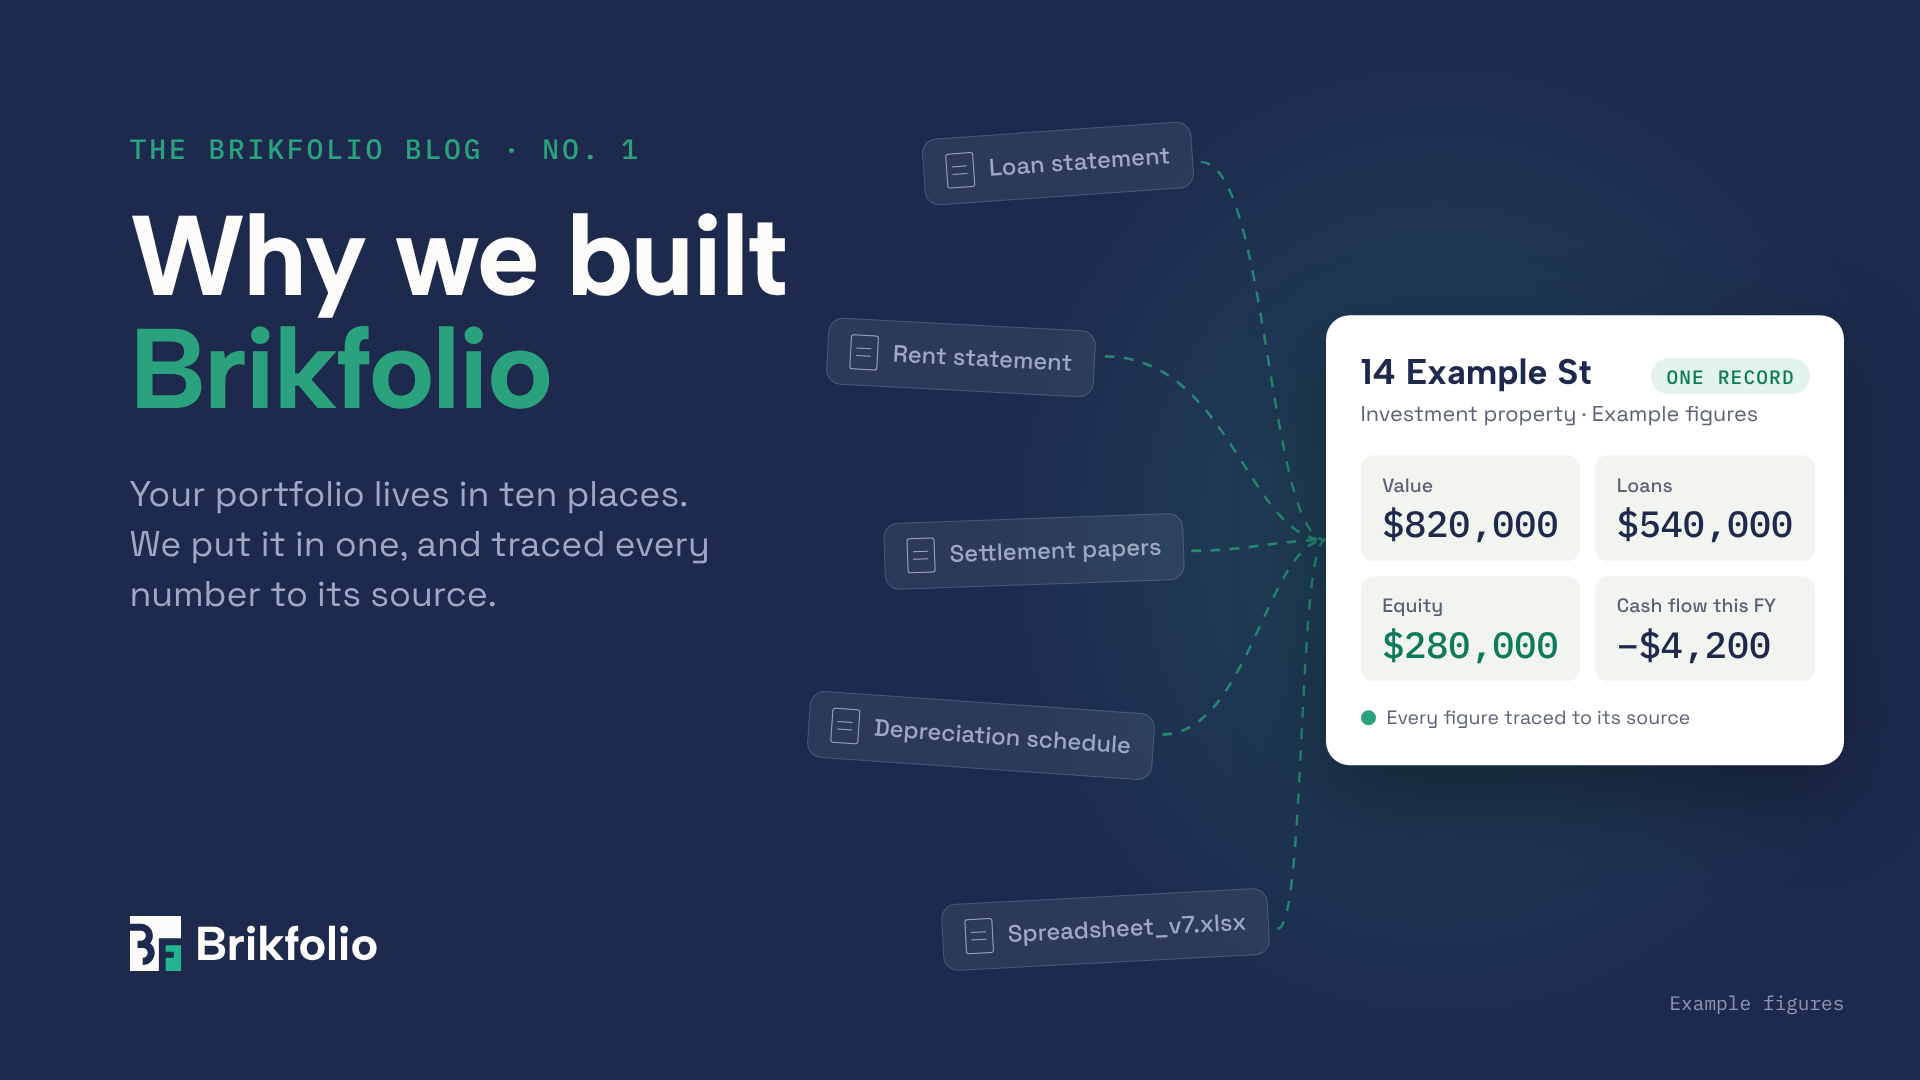
One of us has run a multi-property portfolio for years. The loan statements came from one bank, the rent statements from the property manager, the settlement papers from the conveyancer, and the depreciation schedule sat in a PDF somewhere. Each piece was fine on its own. Nothing showed the whole picture.
The real cost is the guessing
Scattered paperwork is annoying. The bigger problem is what it does to your decisions.
When the numbers live in ten places, simple questions take an evening to answer. What is my real cash flow this year? How much would a rate rise cost me? Can I afford to fix this rate, or switch lenders? So most of us guess, or put the question off.
And tax time turns into a hunt. Your accountant asks for the cost base, the loan interest and the depreciation figures, and you go looking for them all over again.
One record for every property
Brikfolio gives each property one complete record: its value, loans, rent, expenses, tenancy, documents and tax details, all in one place. Your portfolio dashboard then adds them up, so you can see value, equity, debt, yield and cash flow at a glance.
Getting your data in should not be a second job. You can add a property by hand, or upload a settlement statement and let Brikfolio read it for you. You review every line before anything is saved. Bank CSVs match to your transactions automatically.
We hold ourselves to one rule above all others: every number traces back to where it came from. Each figure keeps its source, so you can always answer “where did this come from?” If something is missing, Brikfolio says “not recorded”. It will not show you a confident $0.
When tax time comes, the tax pack pulls each property’s figures together, with the evidence behind them, ready for your accountant.
Test a decision before you make it
Seeing where you stand is step one. The harder part is deciding what to do next. That is what Scenario Studio is for.
You set a what-if: rates rise by 1%, prices stop growing, a property sits vacant for eight weeks, an interest-only loan switches to principal and interest. Brikfolio then compares it with doing nothing, using your own numbers. You get a one-sentence answer, and three tiles that show whether your equity, cash flow and worst year get better or worse.
You can also see:
- how big a rate rise your portfolio can absorb before yearly cash flow goes below zero
- the month your cash would first drop below the buffer you set
- whether refinancing a loan pays for itself, after every fee and break cost
You can save scenarios, compare two side by side, and download a PDF that shows every assumption and where it came from.
What Brikfolio is not
Brikfolio does not replace your accountant, broker or adviser. It gives you, and them, clean numbers to work from. The figures it shows are planning estimates. They are not lender approval, borrowing capacity or financial advice. When a simpler number and an accurate one disagree, we pick accuracy. Your accountant will thank you.
We built it for Australian investors first: Australian dollars, financial years, GST, depreciation and state land tax.
Come and try it
Brikfolio is opening by invitation, a small group at a time. If you own one or more investment properties and you are tired of guessing, we would love to have you.
Join the waitlist at brikfolio.com.au.
In the next few posts we will dig into the questions investors ask us most, starting with what this year’s rate rises mean for your cash flow.
Brikfolio’s figures are planning estimates, not financial advice. Talk to your accountant, broker or adviser before you make a decision.